 Home
Home  Today's Top Picks
  Top Performers
  Watchlist
  My Robo Portfolios
  ETF Zone
  How It Works
  Tutorials
  News
News HELP & TUTORIAL
Upturn: Empowering Your Investment Journey
Learn in-depth about each of the terms
FEATURES
How everyday investors leverage Upturn
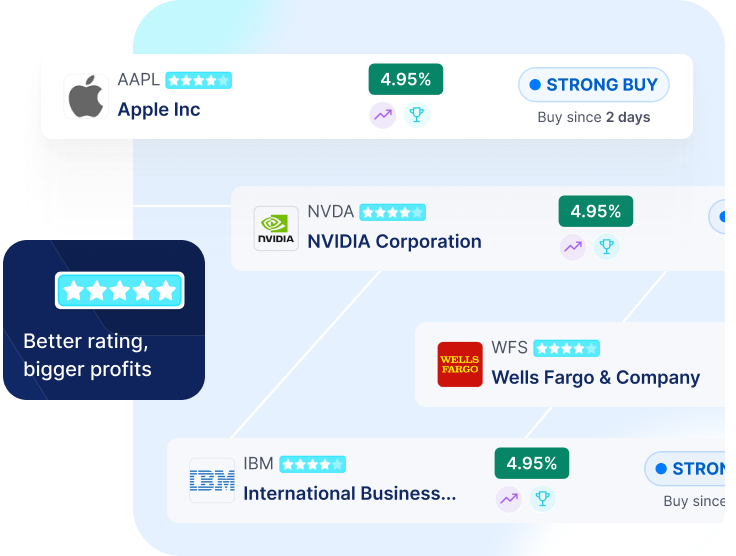
Upturn Advisories is built around a powerful and uncommon principle in the investment world: bold transparency. At its core, Upturn is committed to showcasing not just what it recommends, but how those recommendations have actually performed-offering more than two years of historical BUY and SELL advisories for every stock and ETF it tracks. While many platforms provide star ratings and generic signals, Upturn stands out by making its full recommendation history openly available, enabling investors to evaluate its accuracy and consistency over time and make confident, de-risked decisions.
Upturn leverages advanced AI and proprietary statistical models to generate daily investment advisories for over 9,000 NASDAQ and NYSE-listed US stocks and ETFs. While individual advisories are consistent across users, everyday investors can personalize their experience by applying filters-such as Upturn Star Rating, market cap (large-cap or mid-cap), security type (stock or ETF), stock price range, and current advisory status and by creating custom watchlists or Upturn-assisted Robo-Portfolios aligned with their individual risk tolerance and financial goals.
Each stock or ETF is assigned an Upturn Star Rating, reflecting the investment potential of stocks and ETFs based solely on their historical performance against Upturn Advisories -giving users a quick, data-backed way to assess potential.
To further enrich investment decisions, Upturn provides AI-summarized SWOT-style analyses for each asset. These concise, strategic summaries offer a well-rounded view of strengths, market share, opportunities, financial performance, competition, growth projections, risks, and key trends-insights typically reserved for institutional investors.
What truly sets Upturn apart is this: It doesn’t just tell you what to buy-it shows you how its recommendations have performed.
With this “Boldly Transparent” foundation, Upturn empowers investors to:
- Review and trust the platform’s advisory track record.
- Identify patterns in market movements and sector strength.
- Gain long-term confidence in portfolio construction.
Additional highlights of the platform include:
- Robo-Portfolios: Build diversified, AI-guided portfolios with Upturn’s assistance.
- Retail-First Experience: Intuitively designed for both novice and experienced investors.
- Retail-Ready Intelligence: Visual dashboards, market indicators, and curated portfolios translate complex data into simple decisions.
- Accessible & Affordable: Delivers advisor-level insights at a fraction of the cost, built specifically for the everyday investor.
In a landscape cluttered with opaque advice and one-size-fits-all platforms, Upturn gives retail investors the tools, transparency, and intelligence they need to invest smarter-with clarity and confidence.
Key Benefits of Upturn Advisory for the Everyday Investor
Upturn Advisory is designed to help everyday investors cut through the noise, spot stronger opportunities, and make confident decisions with clear, AI-powered insights.
Spot Opportunities Instantly with AI-Powered Daily Advisories Get clear, automated BUY, SELL, or PASS signals on over 9,000 U.S. stocks and ETFs, so you save time and never miss a potential mover - even if you’re not tracking the market every day.
Build Confidence with a Boldly Transparent History See 2+ years of real historical advisories, helping you check how past signals performed so you can trust today’s calls and make more informed decisions.
Focus on High-Quality Stocks with Upturn Star Ratings Each stock and ETF is given a 1–5 star rating, so you can instantly spot stronger, historically better-performing picks and narrow down thousands of options.
Save Time with Top Picks & Top Performers Explore curated lists of today’s strongest movers and long-term outperformers, so you can discover momentum stocks quickly without hours of manual research.
Diversify Smartly with Robo-Portfolios Create instant or custom portfolios tested through 500+ simulations and scored for risk and return, helping you build a balanced mix that fits your goals - even if you’re new to investing.
Understand Stocks Faster with AI-Summarized SWOT Analysis Read simple, strategic SWOT-style snapshots of each stock’s Strengths, Weaknesses, Opportunities, and Threats, so you grasp key factors in seconds without needing deep research.
Find the Right Picks with Advanced Search & Filters Search by ticker, sector, or theme, then filter by star rating, advisory signal, market cap, and more, so you can easily zero in on stocks that match your strategy and risk comfort.
Stay Ahead with Market Insight Tools Use visual tools like the Upturn Gauge, which tracks BUY vs SELL trends so you can spot bullish or bearish phases and adjust your plan with clarity.
Following sections go into details of these features
Upturn Buy or Sell Advisories
Get daily updated Upturn BUY/SELL recommendations for stocks and ETFs, empowering confident investment decisions.
Upturn Star Ratings for Stocks/ETFs
Upturn's star ratings assist investors in identifying top-performing U.S. stocks and ETFs. Higher ratings reflect stronger historical performance based on Upturn's proprietary analysis.
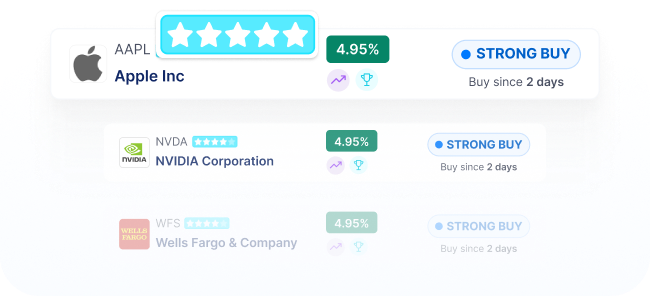
Discover Today's Top Picks
Identify the best-performing stocks of the day, curated by our advanced analysis tools.
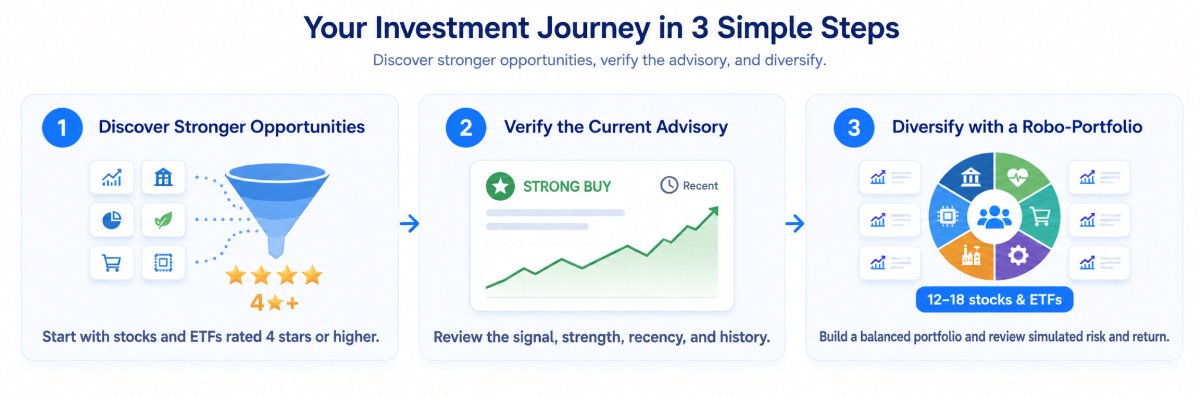
Today's Top Picks highlights stocks with an Upturn Star Rating of 4 or higher, a Strong BUY advisory issued within the last three weeks, classified as Large-Cap or Mid-Cap with at least 500 full-time employees, and showing positive recent profits with a trading volume of at least one million shares.

Discover Top Performers
Track the top-performing US stocks in the market to stay ahead of investment trends.
Upturn's Top Performers showcases large-cap and mid-cap Stocks and ETFs with an Upturn Star Rating of 4 or higher. These selections have demonstrated exceptional returns based on Upturn's BUY and SELL advisories over the past five quarters, as determined through simulations.


Market Insights Based on Upturn Advisories
Leverage Upturn's market-wide advisory trend to anticipate movements and seize opportunities.
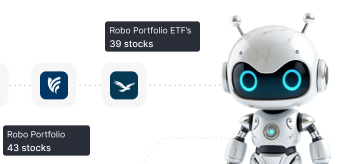
Create Robo-Portfolios Bots
Create diversified, AI-driven portfolios tailored to your investment goals, and receive daily notifications when a stock or ETF becomes a BUY or a SELL.

RESEARCH TOOLS
Holistic Evaluation of Corporate Financials, Strategic Initiatives, and Market Influences
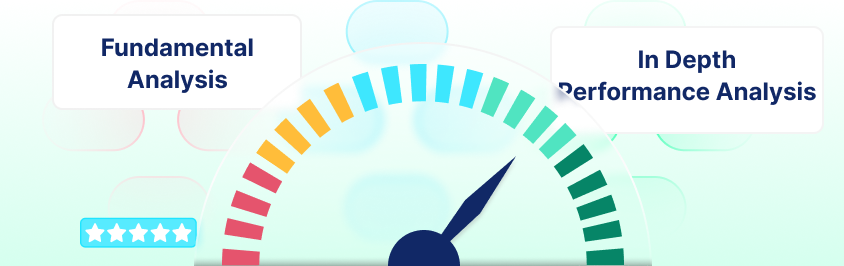
Research on Company’s Fundamentals
Click on "View Details" for the stock/ETF to explore these metrics


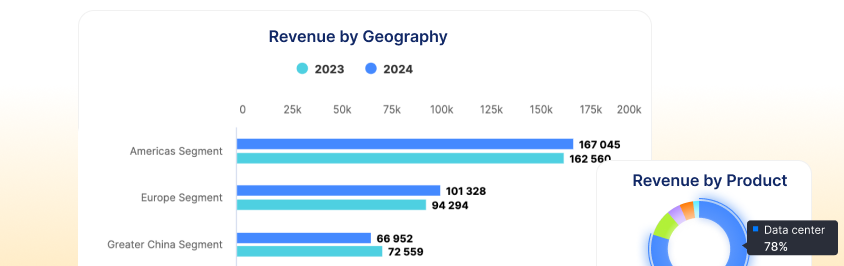
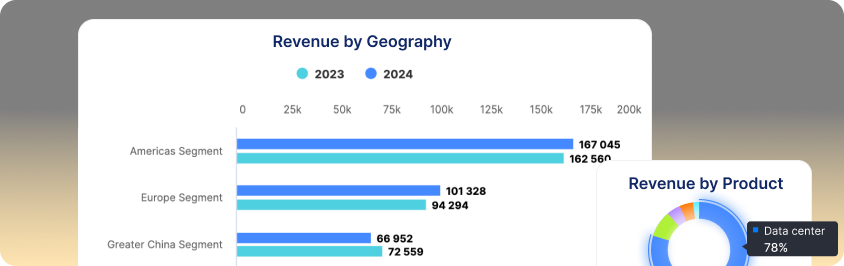
Analyzing Revenue: Products, Geography, and Growth
These charts, offer a visual comparison of revenue across product and geographic segments over a two-year period, showing both segment size and growth.
Click on "View Details" for the stock/ETF to explore these charts.
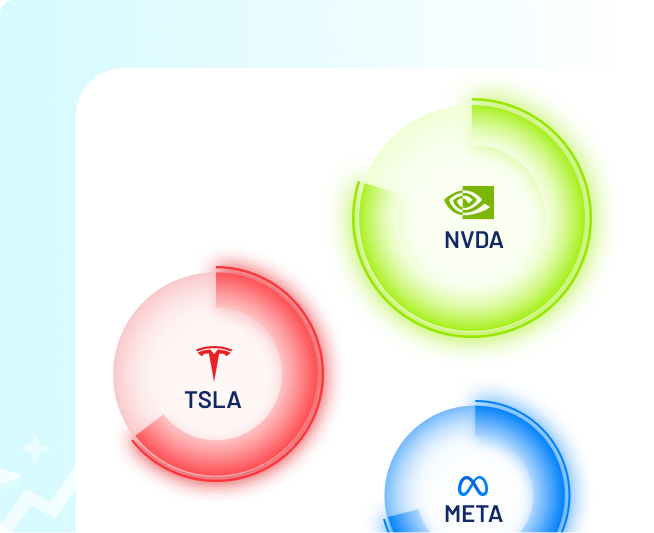
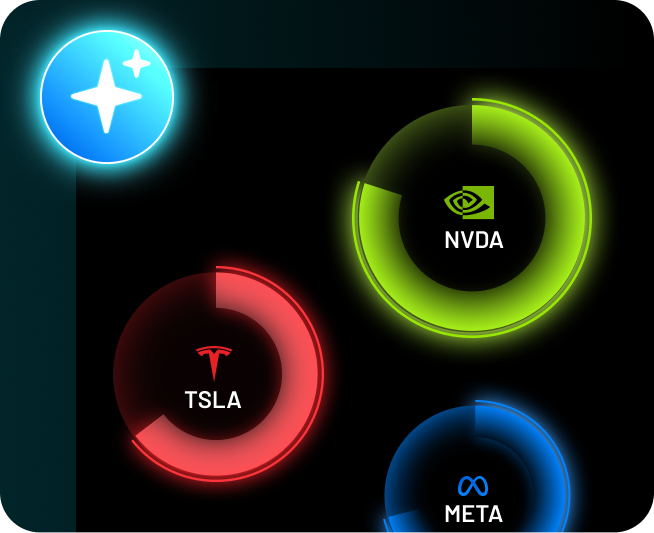
Upturn AI SWOT: Clear, Actionable Stock Analysis
A SWOT-like analysis providing a holistic view of
- Strengths
- Market share
- Opportunities (tailwinds)
- Financial performance
- Competition
- Growth projections
- Challenges (headwinds)
- Key trends
The AI-derived fundamentals rating offers a concise summary of key insights, enhanced by dynamic visualizations, to support informed investment decisions.
Upturn Advisories
Enhance Your Investment Strategy with Upturn's Additional Features
Upturn Gauge: The Pulse of Bulls and Bears
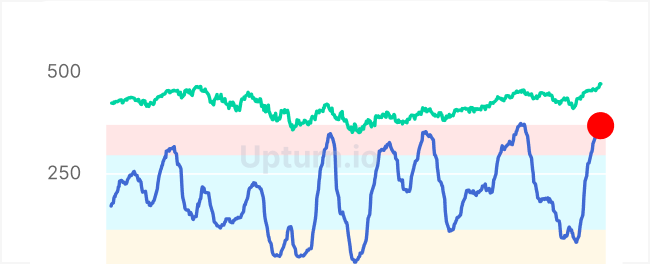
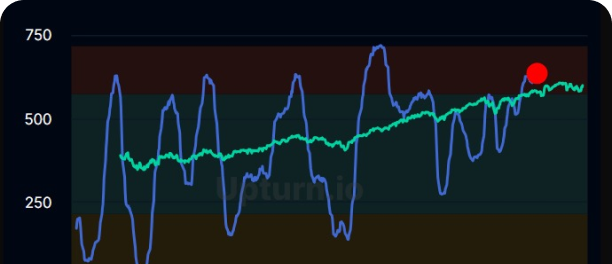
Analyzing the distribution of BUY and SELL advisories among stocks which are Large-cap or Mid-cap and rated Upturn 3 Star or higher reveals overarching trends in the U.S. stock market. This analysis helps identify whether the market sentiment is bullish, bearish, or anticipating a correction.
The Upturn Advisories graph features color-coded sections-yellow, blue, and red-that help investors quickly assess market conditions, indicating periods of recession, growth, or potential correction. This graph is overlaid on the S&P 500 price chart, offering a clear view of the U.S. market's performance.
Understanding Upturn's Stock/ETF Advisory Chart
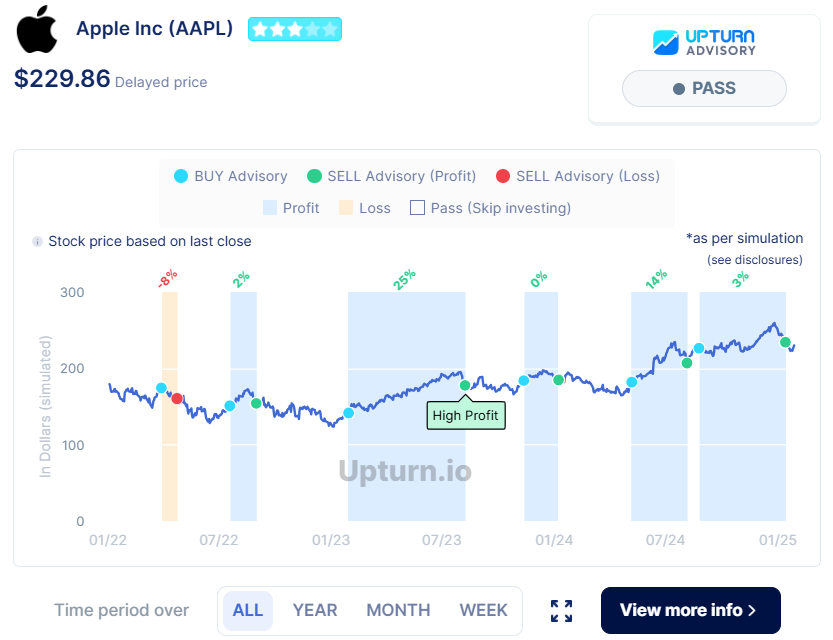
This chart gives a clear, visual overview of Upturn's past BUY and SELL advisories for Apple (AAPL) used as an example, helping everyday investors see how those calls performed and what the current recommendation is.
Key Elements of the Chart
- Stock Price: The price shown ($229.86) is delayed by 24 hours, reflecting the last market close (usually from the previous trading day).
- Upturn Star Rating: Apple’s 3-star Upturn Star Rating indicates that, based on Upturn’s advisory, the stock has historically performed in line with the broader market-delivering stable but modest returns. However, past performance is not indicative of future results.
- Current Advisory: PASS: “PASS” means Upturn does not recommend buying or holding Apple stock at this time.
- Other possible advisories include:
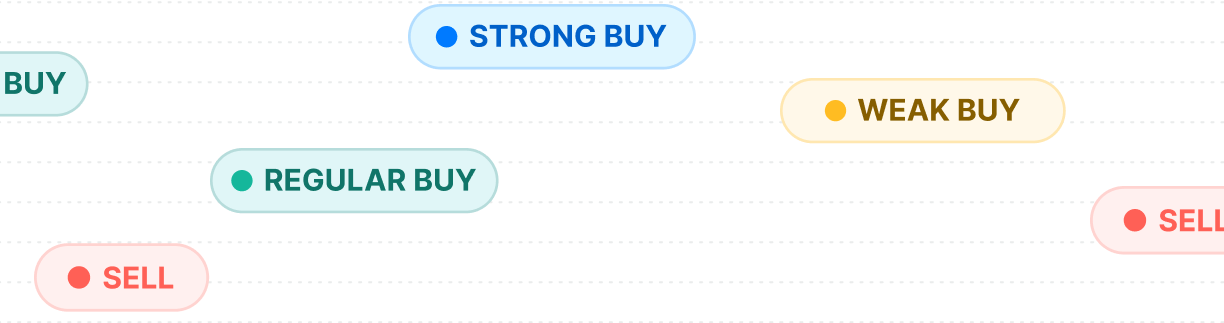
- STRONG BUY / BUY / WEAK BUY – graded confidence in buying
- SELL – indicates it's time to exit if you're holding the stock
- BUY & SELL Dots Explained
- Blue Dots = BUY Signals - When Upturn previously advised buying.
- Green Dots = SELL with Profit - Selling would have earned a gain.
- Red Dots = SELL with Loss - Selling would have resulted in a loss.
- 📊 Profit & Loss Bars
- Blue Bars = Profit - When the simulated trade made money.
- Orange Bars = Loss - When the simulated trade would’ve lost money.
- The percentage above each bar shows how much the simulated trade gained or lost.
- 📅 Time Range & Trend Analysis
- The chart shows how Apple’s price has moved over time, with simulated trades overlayed.
- You can switch between ALL, YEAR, MONTH, or WEEK views to spot short- or long-term patterns.
- This helps identify trends, market cycles, and the timing of past recommendations.
Investors are advised to consult the Disclosures section for details on the assumptions made in these simulations. While the simulations aim for directional accuracy, actual returns may vary due to market conditions and execution factors.
What Do Upturn Advisories Mean?
BUY Advisory (Strong / Regular / Weak)
A BUY advisory means the stock or ETF appears to be trending upward, based on Upturn’s AI/ML and quantitative analysis. There are three levels:
- STRONG BUY
Many strong signals point to an uptrend.
This is a good time to buy the stock or ETF if you are considering an entry. - REGULAR BUY
Moderate signals suggest a likely uptrend.
One might want to wait until it turns into a Strong Buy, but it could still be okay to buy-especially if the BUY advisory is recent (e.g., within the last 20 days). - WEAK BUY
A few mild signals indicate a possible uptrend, but the trend is weak.
This may not be a good time to buy. The advisory could shift to SELL anytime.
Note: If the stock or ETF has a 1- or 2-star rating, even with a BUY signal, Upturn will show: "Consider higher Upturn Star rating" for better historical performance.
- PASS Advisory
A PASS means there’s no strong uptrend at the moment.
It’s best to skip this stock or ETF for now and wait for clearer signals. - SELL Advisory
A SELL advisory appears when growth signals fade and no further upward momentum is expected.
This is a signal to exit the position if you’re already holding it.
Upturn Star Rating for Stocks and ETFs
The Upturn Star Rating is a 1-to-5-star summary of how effectively Upturn’s historical advisories performed for a stock or ETF, combined with important factors that can affect its investability.
The rating starts with the historical results of Upturn’s simulated BUY and SELL advisories. It then considers trading liquidity, the stock’s recent Price Path and Price Stability, and, for individual companies, the strength of company fundamentals.
The Star Rating measures historical and current supporting evidence. It is separate from the current Upturn BUY, SELL, or PASS advisory.
Step 1: Advisory Performance
The rating first evaluates how consistently Upturn’s historical BUY and SELL advisories produced profitable simulated outcomes.
This includes:
- Advisory Success Rate: How often completed Upturn advisory cycles resulted in simulated profits.
- Advisory Consistency: Whether profitable outcomes were produced consistently rather than by only a few successful advisories.
A stronger history of successful advisory outcomes provides a stronger starting point for the rating.
Step 2: Stock Performance
Upturn then measures the simulated investment results produced by following its historical advisories.
This includes:
- Realized Performance: Cumulative simulated profit or loss from completed BUY and SELL advisory cycles.
- Unrealized Performance: Simulated profit or loss associated with the currently open advisory cycle.
- Overall Performance Quality: The strength of the historical simulated return produced across advisory cycles.
Together, Advisory Performance and Stock Performance establish the initial Upturn Star Rating.
Step 3: Trading Volume
Upturn considers the stock’s or ETF’s average trading volume because liquidity affects how easily investors can buy or sell an investment.
- Higher trading volume supports the existing rating.
- Moderate trading volume may reduce the rating by one star.
- Low trading volume may reduce the rating by two stars.
This liquidity adjustment helps prevent a security with strong simulated results but limited tradability from receiving the same rating as a more actively traded investment.
Step 4: Price Path
Price Path evaluates the direction and persistence of the investment’s closing price over approximately the last three market quarters.
The classifications include:
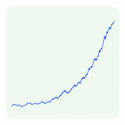
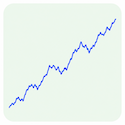

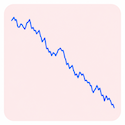
Hockey-Stick Growth: The stock’s price growth is accelerating, with recent gains substantially stronger than its earlier trend. This can indicate powerful momentum, but rapid increases may also bring higher pullback risk. A qualifying Hockey-Stick Growth pattern may increase the rating by one star.
Strong Uptrend: The stock has appreciated substantially while maintaining a clear upward direction. Periodic pullbacks may occur, but buyers have consistently regained control. A qualifying Strong Uptrend increases the star rating by one star but is capped at 5 star.
Steady Uptrend: The stock is rising gradually and consistently without extreme acceleration. Its smoother price path may indicate more stable and sustainable momentum.
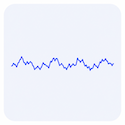
Flat / Range-Bound: The stock has moved within a relatively narrow price range without a clear upward or downward direction. A meaningful breakout or breakdown may be needed to establish its next trend.
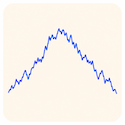
Rolling Over: The stock previously moved higher but has begun losing momentum and turning downward. This may signal a temporary pullback or the early stage of a broader decline.
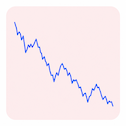
Downtrend: The stock has been declining consistently, with lower prices developing over time. Occasional rallies have not yet been strong enough to reverse the broader downward direction.
Steep Decline: The stock’s price is falling rapidly, with recent losses accelerating beyond its earlier trend. This indicates significant selling pressure and elevated downside risk.
Most normal price fluctuations do not affect the rating. However:
- Hockey-Stick Growth pattern may increase the rating by one star.
- Strong Uptrend increases the star rating by one star but is capped at 5 star.
- Other Price Path classifications provide useful context but do not directly change the rating.
Step 5: Price Stability
Price Stability measures how smoothly or erratically the investment moved along its Price Path during the same three-quarter period.
The classifications include:


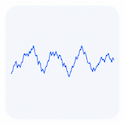
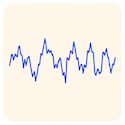
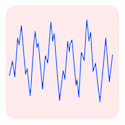
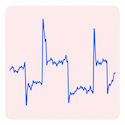
Very Smooth: The stock moves in a highly orderly manner with minimal day-to-day price disruption. Its direction is consistent, with few meaningful reversals or sudden moves.
Smooth: The stock follows a generally orderly path with only modest fluctuations. Short-term pullbacks occur but rarely disrupt its broader direction.
Moderately Choppy: The stock experiences noticeable price swings and periodic reversals while maintaining some directional structure. Investors should expect occasional volatility along its broader path.
Choppy: The stock changes direction frequently and experiences pronounced short-term swings. Its near-term movement may be less predictable even when a broader trend exists.
Highly Choppy: The stock experiences frequent, large price swings in both directions. Rapid reversals can increase timing risk and make its broader direction difficult to follow.
Extreme Price Shocks: The stock has experienced sudden and unusually large jumps or drops relative to its normal movement. These shocks may reflect major events and indicate substantially elevated price risk.
Most normal price fluctuations do not affect the rating. However:
- Highly Choppy price behavior may reduce the rating by one star.
- Extreme Price Shocks may reduce the rating by two stars.
This adjustment recognizes that repeated large price swings can increase investment and timing risk, even when the broader Price Path is positive.
Price Path and Price Stability are independent. For example, an investment can have a Strong Uptrend while also being Highly Choppy.
Step 6: Company Fundamentals
For individual stocks, Upturn applies a final company-fundamentals review based on three areas:
- Financial Health: The company’s financial strength and stability, including balance-sheet and cash-flow considerations.
- Growth Momentum: The consistency and sustainability of business growth.
- Ownership: The level of confidence indicated by insider and institutional ownership.
Weak company fundamentals may reduce the final rating:
- Adequate or strong fundamentals do not change the rating.
- A 2-star Company Fundamentals rating may reduce the Upturn Star Rating by one star.
- A 1-star Company Fundamentals rating may reduce it by two stars.
This helps ensure that strong historical advisory performance is considered alongside the quality of the underlying business.
Company Fundamentals are not applied to ETFs because an ETF represents a portfolio of securities rather than a single operating company.
How the Final Rating Is Determined
The rating is calculated in the following order:
Advisory Performance + Stock Performance → Trading Volume → Price Path → Price Stability → Company Fundamentals
The final result is limited to a minimum of 1 star and a maximum of 5 stars.
For example:
- A stock may begin with a 4-star rating based on historical advisory and simulated stock performance.
- High trading volume leaves the rating unchanged.
- Hockey-Stick Growth adds one star.
- Smooth price behavior causes no adjustment.
- Strong company fundamentals cause no adjustment.
- The final rating is 5 stars.
Another stock may begin with a 5-star rating but receive reductions for low trading volume, Highly Choppy price behavior, or weak company fundamentals.
Why This Matters
Two stocks can have the same current Strong BUY advisory but present very different supporting evidence.
One may have successful historical advisories, high liquidity, a persistent upward Price Path, manageable price fluctuations, and strong fundamentals. Another may have limited liquidity, remain range-bound, experience extreme price swings, or have weak fundamentals.
The Upturn Star Rating brings these factors together so investors can compare the broader quality of the opportunity—not just the current advisory.
Upturn Star Rating for Stocks
5 Star Rating 
 5 Stars — Outstanding: These stocks show the strongest overall combination of historical Upturn advisory success, simulated investment performance, investability, sustained price behavior, and supporting company fundamentals. They represent Upturn’s highest-rated historical opportunities, but the current advisory and its recency should still be reviewed before investing.
4 Star Rating 
 4 Stars — Above Average: These stocks show strong historical Upturn advisory and simulated performance, with generally favorable supporting factors. Some areas—such as price behavior, liquidity, or fundamentals—may be less exceptional than those of a 5-star stock.
3 Star Rating 
 3 Stars — Moderate: These stocks show mixed or moderate historical advisory and simulated performance. Liquidity, Price Path, Price Stability, or company fundamentals may provide limited support or introduce concerns that investors should review.
2 Star Rating 
 2 Stars — Below Average: These stocks show weak historical advisory or simulated performance, or their rating has been reduced by limited liquidity, serious price instability, or weak fundamentals. Investors should carefully review the risks and current advisory before considering them.
1 Star Rating 
 1 Star — Not Recommended: These stocks show the weakest overall historical evidence based on Upturn advisories and simulated performance, potentially combined with poor liquidity, extreme price behavior, or weak company fundamentals. They warrant substantial caution.
Upturn Star Rating for ETFs
For ETFs, the rating uses the same core framework:
Advisory Performance + ETF Performance → Trading Volume → Price Path → Price Stability
Company Fundamentals are not applied to ETFs.
5 Star Rating 5 Stars — Outstanding: These ETFs show the strongest combination of historical Upturn advisory success, simulated performance, liquidity, and supporting price behavior.
4 Star Rating 4 Stars — Above Average: These ETFs show strong historical advisory and simulated performance, with generally favorable liquidity and price behavior.
3 Star Rating 3 Stars — Moderate: These ETFs show moderate or mixed historical advisory and simulated performance, with supporting price characteristics that may be less distinctive.
2 Star Rating 2 Stars — Below Average: These ETFs show weak historical advisory or simulated performance, or may be affected by limited liquidity or serious price instability.
1 Star Rating 1 Star — Not Recommended: These ETFs show the weakest historical evidence based on Upturn advisories and simulated performance, potentially combined with liquidity or price-stability concerns.
Important Interpretation
The Upturn Star Rating and the current Upturn Advisory answer different questions:
- Star Rating: How strong is the investment’s overall historical and supporting evidence?
- Current Advisory: Does Upturn currently indicate BUY, SELL, or PASS?
- Advisory Recency: How recently was the current advisory generated?
A highly rated stock or ETF may still carry a PASS or SELL advisory. Investors should consider the Star Rating, current advisory, advisory recency, Price Path, and Price Stability together.
Historical and simulated results do not guarantee future performance. Upturn Star Ratings and advisories are generated using Upturn’s methodology and should be reviewed together with applicable disclosures.
Making the Most of Upturn Star Ratings
The Upturn Star Rating can help investors make smarter, data-backed decisions:
- Focus on High Performers: Prioritize stocks and ETFs rated 4 stars or above to target historically strong investments.
- Avoid Underperformers: Improve portfolio quality by excluding 1- and 2-star rated assets with weaker performance histories.
- Discover New Opportunities: Uncover high-potential stocks and ETFs that may have been overlooked, guided by their strong Upturn ratings.
- Build Smarter Portfolios: Create diversified Robo-portfolios using a balanced mix of top-rated stocks and ETFs aligned with your goals and risk appetite.
Integrating the Upturn Star Rating into your investment process supports more informed, confident, and goal-oriented decision-making.
Analyzing Revenue: Products, Geography and Growth
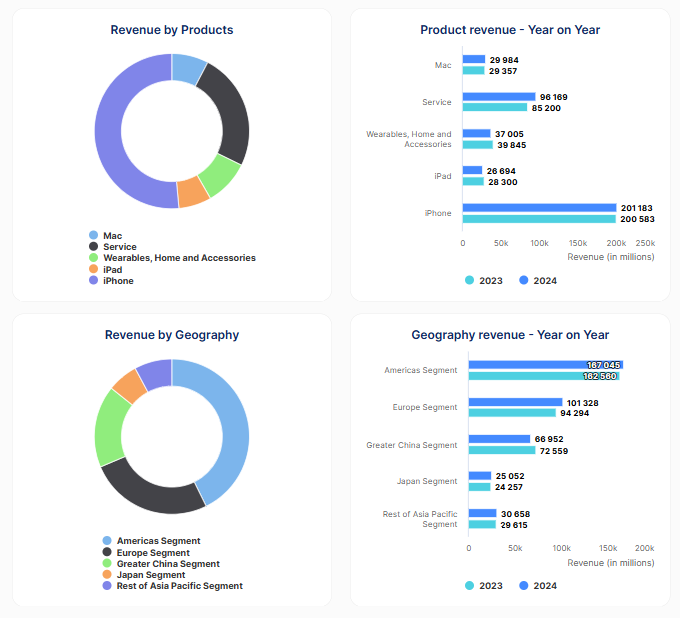
Charts showcasing revenue by product segments and geographic regions, along with year-on-year growth, is provided for every stock, provides the user several key things:
- Revenue Diversification and Concentration (Product & Geography):
- Product Portfolio Analysis: It reveals the company's revenue streams and the relative importance of each product segment. Users can quickly understand if a company's revenue is heavily reliant on a single product or if it has a diversified portfolio.
- Geographic Revenue Analysis: It also shows the distribution of revenue across different geographic regions, indicating the company's reliance on specific markets.
- Revenue Concentration Risk: It highlights potential risks associated with over-reliance on a single product segment or geographic market. If one segment or region underperforms, the company's overall revenue could be significantly impacted.
- Growth Trends (Product & Geography):
- Year-on-Year Performance: It provides a clear picture of how each product segment and geographic region's revenue has changed over time. Users can assess growth rates and identify trends.
- Growth Potential: It helps users evaluate the growth potential of different product segments and geographic markets, identifying areas where the company is experiencing strong growth or decline.
- Business Focus and Strategy (Product & Geography):
- Strategic Priorities: It reveals the company's strategic focus and priorities, both in terms of product development and market expansion. Users can see which segments and regions are generating the most revenue and likely receiving the most investment.
- Business Model Insight: It provides insights into the company's business model and its geographic footprint, showing how it generates revenue across different markets.
- Comparative Analysis:
- Benchmarking: Users can compare the revenue performance of different companies within the same industry, both in terms of product segments and geographic reach.
- Investment Decisions: This information helps users make informed investment decisions by understanding the revenue dynamics of each company, considering both product and geographic diversification and growth.
In essence, it gives the user comprehensive insight into the revenue health and business strategy of a company, considering both product and geographic dimensions, and allows them to perform detailed comparative analysis.
Watchlist, Robo-Portfolios and ETF Zone


Upturn.io's dashboard offers a suite of curated tools designed to enhance your investment experience.
The Watchlist feature allows you to monitor your preferred stocks and ETFs, providing real-time advisories and performance updates.
With Robo-Portfolios, you can create and manage personalized collections of stocks and ETFs, either through automated sampling or by selecting assets that align with your specific interests and risk criteria or any other filters. This enables you to evaluate portfolio performance and receive timely notifications on advisory changes.
Additionally, the ETF Zone showcases all Upturn 3+ Star Rated ETFs, assisting you in identifying top-rated exchange-traded funds for potential investment opportunities.
Instant and Custom Robo Portfolios

Upturn.io empowers investors with Robo-Portfolios, enabling seamless stock and ETF discovery through AI-driven portfolio creation.
With Instant Robo-Portfolios, users can generate optimized portfolios in seconds (usually less than a minute) based on their custom filters, leveraging Upturn’s advanced simulations.
Behind the scenes, for Instant robo-portfolios, Upturn enhances portfolio creation by generating 500 simulated portfolios, each comprising randomly selected stocks/ ETFs based on user-defined filters. The platform then identifies the portfolio with the strongest historical performance and highest Sharpe Ratio. This random selection process ensures that, given a sufficiently diverse pool of stocks and ETFs curated through the filter, each simulation yields a unique portfolio, even when applying the same filters.
For a more tailored approach, Custom Robo-Portfolios allow users to define filters, handpick stocks or ETFs, and track their investments effortlessly.
Every Robo-Portfolio on Upturn is assigned an Upturn Star Rating, reflecting its historical cumulative returns and Sharpe ratios based on investments made following Upturn's advisories. This rating provides investors with a clear understanding of the portfolio's past performance and risk-adjusted returns.
With Robo-Portfolios, investors can experiment with multiple strategies, refine their holdings, and compare their portfolio's performance against the SPY index, utilizing Upturn's advisories. The platform offers feedback on portfolio composition, such as diversification levels (e.g., holding fewer than 12 stocks may indicate less diversification) and the inclusion of higher-rated Upturn stocks. Additionally, it displays current BUY and SELL advisories for each asset within the Robo-Portfolio, enabling data-backed investment decisions with confidence.
Robo-Portfolios Vis-à-Vis Robo-Advisors
Upturn Robo-Portfolios give you the power of a robo-advisor, with the flexibility of a DIY strategy-and none of the guesswork. With transparent performance metrics, daily signals, and customizable filters, it’s like building a portfolio with a research team by your side. If you're ready to take charge of your investing without flying blind, Upturn might just be your smarter, data-driven alternative to traditional robo-advisors.
Upturn vs. Robo-Advisors: A Side-by-Side Comparison
| Feature | Upturn Robo-Portfolios | Traditional Robo-Advisors |
|---|---|---|
| Asset Selection | Stocks & ETFs | Primarily ETFs |
| Portfolio Control | No asset managed by Upturn. Upturn is Advisory only. Portfolio is Fully customizable by user and is DIY (do it yourself) | Automated based on risk profile |
| AI Signals | Daily BUY/SELL/PASS signals | None |
| Backtesting | Yes, with 2-year performance simulation | Rare or hidden |
| Transparency | Full visibility into rating logic and performance | Often black-box algorithms |
| Risk Adjustment | Sharpe ratio + advisory signal quality | Risk profile allocation only |
| Thematic Filtering | Yes (e.g., large-cap tech, top performers) | No |
| Rebalancing | Manual or DIY via alerts | Automatic |
| Learning Opportunity | High – educates users on how individual picks perform | Low – set it and forget it |
| Cost | Very low, designed for everyday investor | Typically 0.25–0.50% AUM annually |
Robo-Portfolio Construction Guidelines
A minimum of 12 stocks is recommended per Robo-Portfolio (especially if all are stocks) to promote diversification.
Upturn does not enforce sector or market diversification-stock selection is guided by user-defined filters such as:
- Upturn Star Rating
- Market Capitalization (e.g., large-cap or mid-cap or small-cap)
- Security Type (stock or ETF)
- Stock Price Range
- Current Advisory Status (e.g., Strong Buy, Buy, Pass)
The stocks and ETFs are chosen from the pool that matches the selected filters-either randomly, in full, or selectively based on additional user preferences, such as deeper research into specific companies.
Robo Portfolio Performance Metrics
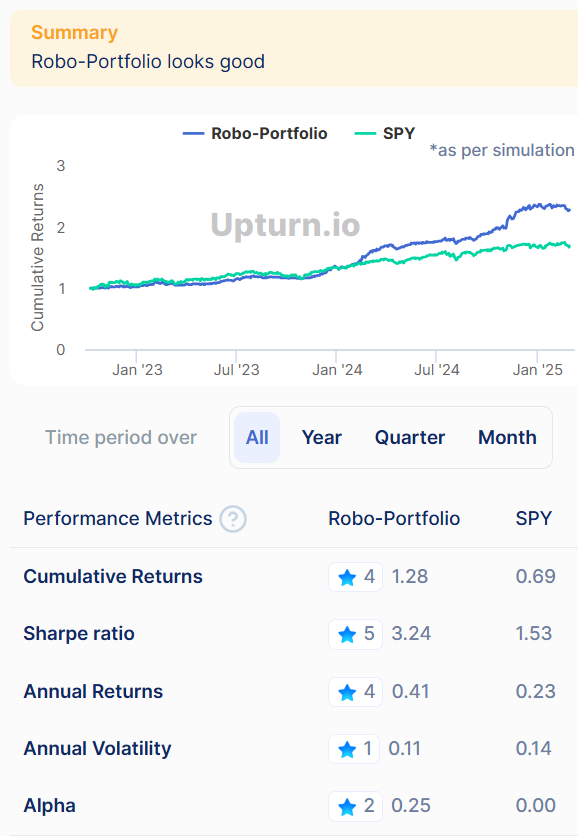
Each Robo Portfolio includes a Comprehensive performance metrics, including cumulative returns benchmarked against the S&P 500, Sharpe Ratio, annual returns, and volatility, offer deep insights into portfolio effectiveness.
Robo-Portfolios on Upturn.io are evaluated using multiple key metrics to help investors make informed decisions.
The Summary provides a high-level overview, including factors such as the number of stocks in the portfolio and the presence of higher-rated Upturn stocks.
To illustrate potential gains, Upturn.io simulates a hypothetical investment of $1.0 in an equal-weighted Robo-Portfolio, tracking performance based on Upturn’s BUY and SELL advisories. This is then compared to the same investment in SPY, providing a tangible measure of portfolio strength.
Beyond cumulative returns, additional portfolio performance metrics include the Sharpe Ratio, Annual Returns, Annual Volatility, and more.
Users can access detailed explanations of these metrics by clicking the help button next to Performance Metrics or in the Description of terms below.
Upturn Star Rating for Robo-Portfolios

The Upturn Star Rating for Robo-Portfolios indicates the overall investment potential based on historical advisory performance of a portfolio, based on a hypothetical investment strategy that follows Upturn’s BUY and SELL advisories. The rating is derived from the collective performance of the individual stocks or ETFs in the portfolio over a selected time period-past two years, one year, one quarter, or one month-as captured in the Robo Portfolio Performance metrics. It combines both cumulative returns and risk-adjusted performance to offer a comprehensive view of portfolio quality.
How Upturn Calculates Star Ratings for Robo-Portfolios
- Cumulative return: Measures how well the portfolio would have performed if an investor had followed Upturn’s historical advisories in the given time.
- Sharpe ratio: Captures the risk-adjusted return-measures how much return a portfolio generates relative to the amount of risk taken, helping assess the quality of returns after accounting for volatility.
Understanding Robo-Portfolio Star Ratings
The Robo-Portfolio Star Rating is calculated on a portfolio simulation which is over the past two years. Portfolios are then rated from 5 stars to 1 star based on the thresholds below:
5 Stars (Outstanding) Robo-Portfolios with a cumulative return of 2.0 or higher and a Sharpe ratio of at least 1.75. These portfolios have shown strong historical returns combined with efficient risk-adjusted performance.
4 Star Rating (Above Average) Robo-Portfolios with a cumulative return of at least 1.5 and a Sharpe ratio of 1.5 or more. These have demonstrated solid historical outcomes with favorable risk-return characteristics.
3 Star Rating (Moderate) Robo-Portfolios with a cumulative return of at least 1.0 and a Sharpe ratio of 1.0 or greater. These generally align with market-level returns and offer balanced risk-adjusted results.
2 Star Rating (Below Average) Robo-Portfolios with a cumulative return of at least 0.75 and a Sharpe ratio of 0.75 or higher. These show weaker historical performance and less efficient use of risk.
1 Star Rating (Not Recommended) Robo-Portfolios that do not meet the minimum thresholds. They have lower cumulative returns and subpar risk-adjusted performance based on historical advisory data.
⚠️ Important Note
Upturn Star Ratings for stocks and ETFs, or Robo-Portfolios reflect overall investment potential based on historical performance and, for Robo-Portfolios, favorable risk-adjusted returns. However, a higher rating does not guarantee higher future returns, and a lower rating does not imply poor future performance. Past results show the potential but are not a guarantee of future outcomes.
Upturn’s Analyst Coverage Star Rating
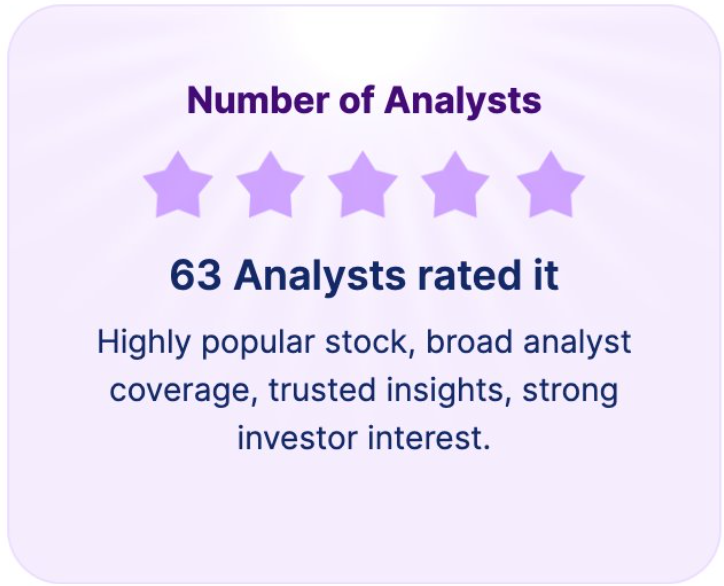
While Upturn’s AI analyzes data and historical performance, the Analyst Perspective summarizes professional Wall Street sentiment. Think of this as the "human intelligence" layer. Analysts often have deep industry access, so their collective outlook provides crucial market context that data alone might miss.
How the Analyst Rating is Built
Rather than a simple average, the rating is a carefully balanced assessment of three key factors. We prioritize confidence and consensus to ensure the rating is as accurate as possible:
- Analyst Coverage (The Confidence Level) We believe there is safety in numbers. More eyes on a stock generally mean more reliable information and stronger institutional visibility.
- High Coverage (30+ Analysts): These are "Blue Chip" stocks with massive institutional interest and broad, trusted insights.
- Moderate Coverage (10–19 Analysts): Growing companies that are starting to capture significant market attention.
- Low Coverage (Under 5 Analysts): Niche or early-stage firms where research is limited and uncertainty is higher.
- Rating Distribution (The Consensus) This looks at the balance of Buy, Hold, and Sell recommendations. It tells you at a glance if the "smart money" is optimistic or leaning toward caution. A high score here means most analysts are in agreement about the stock’s potential.
- Price Target Upside (The Growth Gap) Analysts set a "Fair Value" for where they expect the stock to be in 12 months.
- Strong Potential: A high score is typically triggered when the average Target Price is at least 20% higher than the current market price.
- Full Valuation: If the current price is already near the target, the score may be lower, suggesting the stock has already reached its "fair value" for now.
1-Year Price Target Chart
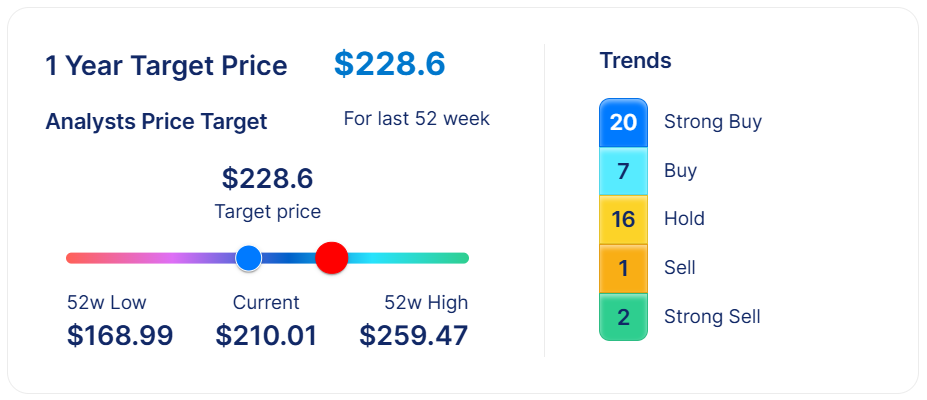
Reading the 1-Year Price Target Chart
The chart provides a visual map of where the stock sits today compared to where experts think it is headed.
- Target Price: The average "destination" analysts expect in one year.
- The 52-Week Range (High/Low): Provides context on how volatile the stock has been over the past year.
- Current Price: Shows you exactly how much "room to run" is left before hitting the average analyst forecast.
By comparing these, you can quickly see whether the stock has room to grow (if the target price is well above the current price) or if it may already be close to its fair value range.
Analyst Trends (Strong Buy to Strong Sell) On the right, you can see how many analysts recommend each action:
- Strong Buy - Analysts see strong upside, usually based on healthy fundamentals or growth signals.
- Buy - A positive outlook, but with more caution than Strong Buy.
- Hold - Analysts believe the stock is fairly valued at present.
- Sell / Strong Sell - Rare, but indicates some analysts expect the stock to underperform.
- 20 Strong Buy, 7 Buy, and 16 Hold - showing most analysts are optimistic.
- 1 Sell and 2 Strong Sell - very few negative recommendations.
Putting It All Together Combining these details gives you a fast, high-level snapshot:
- Is the stock trading below its 1-year target price?
- Where is the current price compared to the lowest and highest price seen in the last year?
- Do analysts mostly see upside, downside, or stability ahead?
If the target price is higher than the current price, the stock is closer to its 52-week high than its low, and most analysts rate it a Strong Buy, this suggests strong market interest and a positive outlook - but always remember: it’s a forecast, not a guarantee.
Use this as a starting point for deeper research alongside other fundamentals and Upturn’s AI-powered advisories.
From Search to Success: Search powered by AI

Upturn simplifies and enhances your investment journey with robust search functionalities and personalized tools.
Efficient Search Capabilities Effortlessly locate stocks and ETFs by entering their names or symbols into the search bar. For batch searches, input multiple symbols separated by commas (e.g., "AAPL,TSLA,AMZN,MSFT") to view collective advisories. Moreover, Upturn's AI-driven natural language processing allows searches based on themes or sectors, such as "Apparel retailers", "CPU manufacturers", "Lithium companies" or "ETFs on cleantech" delivering relevant results tailored to your interests.
Interactive Stock and ETF Exploration Clicking on any stock or ETF card reveals detailed information and performance charts. Utilize the "Add to List" feature to seamlessly incorporate assets into your personalized "Watchlist" or any "Robo-Portfolio," facilitating organized tracking and management of your investments.
Customizable Robo-Portfolios Upturn empowers you to create Robo-Portfolios from search results, enabling the construction of diversified portfolios aligned with your investment strategies. This feature supports both instant and customized portfolio creation, allowing for tailored investment approaches.
Experience a streamlined and intelligent investment process with Upturn.io, designed to cater to both novice and seasoned investors.
Smarter Investment Discovery with Upturn Filters

Powerful Search & Filtering Upturn enhances your investment research with advanced filtering options, allowing you to tailor searches for stocks and ETFs based on specific criteria. Whether you're looking for high-performing assets, market trends, or personalized investment opportunities, Upturn makes it simple and effective.
Personalized Investment Filters Easily refine your search by filtering stocks/ETFs with a "BUY" advisory or an Upturn 4+ Star rating. Additional filters allow you to sort by asset type (stocks or ETFs), market capitalization (e.g., large-cap), and Upturn advisory performance (historical accuracy of recommendations). You can also assess Upturn stock performance (how stocks reacted to Upturn's BUY and SELL signals), company size, daily trade volume, or whether an asset is currently labeled as a Top Performer or Top Pick.
Risk Awareness & Enhanced Insights To help investors assess risk effectively, Upturn incorporates risk annotations, categorizing filter selection as "low-risk" "medium-risk" or "high-risk" These labels consider factors like company size, trade volume, and historical advisory performance, providing an extra layer of transparency for decision-making.
Confident, Data-Driven Investing By leveraging Upturn's robust search and filtering capabilities, investors can efficiently discover, analyze, and act on investment opportunities that align with their financial goals and risk preferences.
Upturn Market Overview
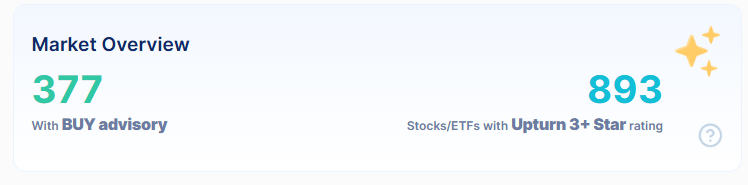
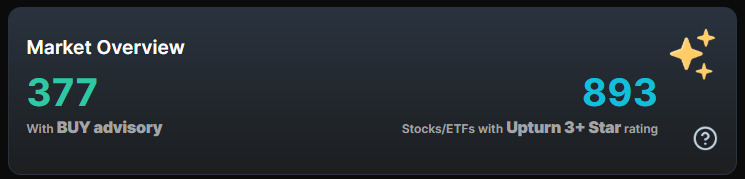
Upturn's dashboard features a Market Overview card displaying the total number of Upturn 3+ Star-rated, Large-cap or Mid-cap stocks, along with those currently holding a BUY recommendation.
Investors can easily access filtered lists by clicking on these numbers, streamlining the process of identifying top-rated investment opportunities.
Descriptions of terms and metrics
The following section describes performance metrics and terms used
Note: Please see the Disclosures for Performance Metrics and Simulations for assumptions and considerations used in the simulation (hypothetical) returns and ratios.
Upturn Star Rating For Stocks
The Upturn Star Rating primarily reflects the historical performance and confidence of the Upturn Advisory Rating, provided the company has strong fundamentals (typically 4 stars or higher). Over time, additional factors such as unit economics, analyst perspective, competitive positioning, quantitative market behavior, and other business insights will increasingly influence the overall rating.
Why This Matters
This rating helps you quickly understand whether a stock has historically performed well based on Upturn’s advisory signals, while also ensuring the underlying business fundamentals support those signals. As more factors are incorporated, the rating provides an increasingly balanced view of both performance and business quality.
Formula
If Company Fundamentals Rating ≥ 4 Stars: Upturn Star Rating = Upturn Advisory Rating
If Company Fundamentals Rating < 4 Stars: Upturn Star Rating = Adjusted (lower) value of Upturn Advisory Rating
The final score is then mapped to a 1–5 star rating scale.
Factors Affecting the Upturn Star Rating
Primary Factor
Advisory Confidence
The main driver of the rating, based on how Upturn’s historical advisory signals have performed relative to the market.
Supporting Factor
Company Fundamentals
Ensures the company has strong financial health, growth potential, and ownership stability to support the advisory signal.
Factors Increasingly Included Over Time
Quantitative Style Classification
How the stock behaves in the market (momentum, value, quality, volatility, etc.).
Unit Economics
How efficiently the business converts revenue into profits and cash flow.
Analyst Perspective
Professional analyst sentiment, coverage, and expected price upside.
Competitive Positioning
Industry strength, innovation leadership, market opportunity, and long-term business advantages.
Company Fundamentals
Company fundamentals evaluate the core strength of the business by looking at financial health, growth momentum, and ownership stability.
Financial Health → Is the company financially strong and stable?
Growth Momentum → Is the company growing consistently?
Ownership Score → Do insiders and institutions show confidence?
Why this matters:
Strong fundamentals usually mean a business can survive downturns, grow steadily, and attract institutional investors.
Formula:
Average of Financial Health Score, Growth Momentum Score and Ownership Score
Financial Health
Financial Health evaluates how stable a company is financially by examining profitability, operational efficiency, liquidity, and cash strength.
Profitability → How much profit the company generates.
Efficiency → How well it controls costs.
Liquidity → Ability to meet short-term obligations.
Cash Strength → Ability to generate sustainable cash flow.
Why this matters:
Financially healthy companies are generally less risky, more resilient during economic downturns, and better positioned for long-term growth.
Financial Health Formulas
Overall Score
Balances profitability, cost efficiency, liquidity, and cash strength to give a holistic view of financial stability, with slightly higher weight on profitability as it reflects core business sustainability.
0.30 × Profitability + 0.25 × Efficiency + 0.25 × Liquidity + 0.20 × Cash Strength
Profitability
Measures how effectively the company converts revenue into profits across multiple margin levels, capturing both operational performance and bottom-line strength.
Average percentile scores of
Gross Margin - Revenue left after direct production costs.
EBITDA Margin - Core operating profit before interest, taxes, and non-cash costs.
Operating Margin - Profit after operating expenses.
Net Margin - Final profit after all expenses and taxes.
Efficiency
Evaluates how well the company controls operating and production costs, since disciplined cost management often supports consistent profitability.
0.50 × OpEx Ratio + 0.50 × Cost of Revenue Ratio
OpEx Ratio - Share of revenue spent on operating expenses.
Cost of Revenue Ratio - Share of revenue spent on direct production costs.
Liquidity
Assesses the company’s ability to meet short-term obligations and sustain operations using working capital, cash generation, and asset utilization.
0.40 × Working Capital + 0.30 × Free Cash Flow + 0.30 × Asset Turnover
Working Capital - Current assets minus current liabilities.
Free Cash Flow (FCF) - Cash left after operations and investments.
Asset Turnover - Revenue generated per dollar of assets.
Cash Strength
Focuses on the company’s ability to generate real cash from operations, emphasizing free cash flow while also considering earnings strength.
0.50 × Free Cash Flow Strength + 0.25 × EBITDA Strength + 0.25 × Net Income Strength
Free Cash Flow Strength - Consistency of surplus cash generation.
EBITDA Strength - Strength of core operating earnings.
Net Income Strength - Strength of final reported profits.
Growth Momentum
Growth Momentum measures how quickly a company is expanding across revenue, earnings, cash flow, profitability, and financial strength.
Why this matters
Companies with sustained growth tend to attract investors, expand market share, and often deliver stronger stock performance over time.
Growth Momentum Formula
0.30 × Revenue Growth + 0.25 × Earnings Growth + 0.20 × Free Cash Flow Growth + 0.15 × Profitability + 0.10 × Balance Sheet Strength
Growth rates are percentile ranked
~50% growth → high score (~90)
~20% growth → moderate (~70)
Positive growth → baseline (~50)
Ownership Score
Ownership Score evaluates investor confidence based on institutional ownership, insider holdings, and share float liquidity.
Institutional Ownership → Confidence from professional investors.
Insider Ownership → Alignment between management and shareholders.
Float → Ease of trading and market stability.
Why this matters:
Higher institutional and insider ownership often signals confidence and stability, while sufficient float improves liquidity.
Ownership Score Formula
0.40 × Institutional Ownership Score + 0.35 × Insider Ownership Score + 0.25 × Float Score
Typical scoring:
Institutions ≥70% → strong confidence
Insiders ≥10% → strong alignment
Float ≥80% → good liquidity
Unit Economics
Unit Economics evaluates how efficiently a company converts revenue into profit, cash flow, and operational value.
Profitability → Profit generated per unit of revenue.
Quality → Conversion of accounting profits into cash.
Efficiency → Effectiveness of capital use.
Why this matters:
Strong unit economics indicate a scalable business model that can grow sustainably without excessive capital.
Unit Economics Formula
0.20 × Profitability + 0.25 × Operating Income + 0.25 × Free Cash Flow Strength + 0.15 × Quality + 0.15 × Efficiency
Here:
Profitability (Gross Profitability) – Profit after direct costs, usually measured by gross margin.
Operating Income (Operating Profitability) – Profit after operating expenses, reflecting core business performance.
Free Cash Flow Strength – Cash left after capital spending for growth or returns.
Quality (Earnings Quality) – How well profits convert into cash (FCF / Net Income).
Efficiency (Capital Efficiency / ROIC) – How effectively invested capital generates returns - Return on Invested Capital
Quantitative Style Classification
This classification describes how the stock behaves in the market using quantitative investment factors.
Key factors include:
Momentum → Measures how strongly a stock’s price has been trending up or down over time.
Value → Indicates how attractively a stock is priced relative to its fundamentals like earnings or assets.
Quality → Reflects financial strength, profitability, and overall business stability.
Volatility → Shows how much a stock’s price fluctuates, indicating potential risk.
Size → Categorizes companies based on market capitalization (small, mid, or large cap).
Short Interest Pressure → Indicates bearish sentiment based on the level of short selling activity.
Liquidity → Measures how easily a stock can be traded without significantly impacting its price.
Why this matters
Understanding factor exposure helps investors build balanced portfolios and manage risk more effectively.
Quantitative Style Formula
Average of (Momentum, Value, Quality, Volatility (inverse), Size, Short Interest Pressure, Liquidity)
Momentum Formula
0.40 × Above 200-Day Moving Average + 0.30 × Above 50-Day Moving Average + 0.30 × Drawdown from Recent High
Above 200-Day Moving Average → Indicates long-term price trend strength. Usually signals a bullish long-term trend when price stays above it.
Above 50-Day Moving Average → Reflects short- to medium-term momentum. Being above it suggests near-term positive momentum.
Drawdown from Recent High → Measures how far price is below its recent peak. Smaller drawdown suggests strength; larger drawdown may indicate weakness or correction.
Value
Average of valuation ratios:
P/E (Price-to-Earnings) → Compares stock price to earnings per share. Lower values often suggest cheaper valuation, higher may imply growth expectations.
EV/EBITDA → Compares total company value to operating earnings. Helps assess valuation independent of capital structure.
Price/Sales → Compares stock price to revenue per share. Useful when earnings are volatile or negative.
Ranked into valuation bands.
Quality
Average of:
ROE (Return on Equity) → Measures profit generated from shareholder equity. Higher values usually indicate efficient capital use.
ROA (Return on Assets) → Shows profit generated from total assets. Higher indicates better asset efficiency.
Operating Margin → Percentage of revenue after operating costs. Higher margins indicate stronger core profitability.
Ranked into valuation bands.
Analyst Perspective
Analyst Perspective summarizes professional Wall Street sentiment using coverage levels, ratings, and expected price upside.
Why this matters
Analysts often have deep industry research, so their sentiment provides additional market context.
Analyst Perspective Formula
0.40 × Analyst Coverage + 0.40 × Rating Distribution + 0.20 × Price Target Upside
Coverage
Higher analyst count → higher confidence score.
Analyst Count buckets (30+ -> 100)
Rating Distribution
Weighted average of Buy, Hold and Sell ratings
Upside
(Target Price – Current Price) / Current Price
≥20% upside typically yields strong scores.
AI SWOT Analysis
AI SWOT Analysis evaluates a company’s strategic position using AI-derived insights across Strengths, Weaknesses, Opportunities, and Threats from financial data, industry trends, competitive signals, and market context.
Why This Matters
It helps investors understand long-term business advantages, risks, and growth potential beyond financial metrics alone.
AI SWOT Score Formula
Average(Strength, Weakness (inverse), Opportunity, Threat (inverse))
Weaknesses and threats are inversely scored so higher risks reduce the overall rating.
Component Scores
Strength – AI-derived assessment of competitive advantages, financial stability, innovation, and market leadership (0–5 scale).
Weakness (Inverse) – AI-derived assessment of internal risks such as operational issues, debt, or margin pressure; higher weakness lowers the score.
Opportunity – AI-derived assessment of growth potential from new markets, products, industry expansion, or innovation.
Threat (Inverse) – AI-derived assessment of external risks including competition, regulation, macro factors, or disruption.
Additional Definitions
Total Revenue
Total income from selling products or services before expenses. Shows business scale and demand for its products or services.
Cost Of Revenue
Direct costs incurred to produce and deliver products or services. Helps assess production efficiency and cost control.
Gross Profit
Revenue remaining after direct production costs. Indicates how much profit remains after direct costs.
Total Operating Expenses
Indirect business costs like salaries, marketing, and administration. Reveals how efficiently the company manages operating costs.
EBITDA
Earnings before interest, taxes, depreciation, and amortization; reflects operating cash potential. Helps evaluate core operating performance independent of financing effects.
Operating Income
Profit from core operations after operating expenses. Shows profitability from main business activities.
Net Income
Final profit after all expenses, interest, and taxes. Represents overall profitability available to shareholders.
Net Working Capital
Current assets minus current liabilities, showing short-term liquidity. Indicates short-term financial health.
Free Cash Flow
Cash remaining after operations and capital spending. Shows cash available for growth, debt repayment, or dividends.
Total Assets
Total value of everything the company owns. Reflects company size and resource base.
Income Tax Expense
Taxes paid or owed to the government. Helps understand tax burden and efficiency.
Income Before Tax
Earnings before income tax deduction. Shows earnings power before tax impact.
Short Long Term Debt Total
Total of both short-term and long-term debt. Indicates leverage level and financial risk.
Total Stockholder Equity
Total ownership value held by shareholders. Represents shareholder value and financial stability.
Cash
Cash and cash equivalents available to the company. Shows liquidity and ability to meet immediate obligations.
BUY Advisory (strong/regular/weak)
“BUY” advisory indicates the stock or ETF could be in an Upturn or upwards trending based on the AI/ML and Quantitative analysis. The “BUY” advisory is often annotated such as
- STRONG BUY
- REGULAR BUY
- WEAK BUY
All of these indicate a “buy” advisory based on technical analysis (AI/ML and Quantitative) but shows different degree of trends or factors which are positively influencing the “buy” advisory. For instance, “strong buy” has more trends or factors in the algorithm showing positive “buy” trend compared to “regular buy” and has much lower trends or factors suggesting “buy” for “weak buy”.
Also, if the Stock or ETF has Upturn star rating of 1 or 2, the “BUY” advisory is shown as “Consider higher Upturn Star rating”
PASS Advisory
A “pass” advisory indicates that there are no upturns or upward trends seen in the stock or ETF to recommend a “buy” for now and hence the stock or ETF could be passed for now.
SELL Advisory
When the technical analysis (AI/ML and Quantitative) doesn’t show any continued positive trends or factors to further influence the upward movement of the Stock or the ETF, the BUY advisory is updated to a SELL advisory.
Stocks and Stocks Chart (Simulated)
Following are terms and its definitions and assumptions used when showing the Company’s historic recommendations.
Note: Please see the Disclosures for Performance Metrics and Simulations for assumptions and considerations used in the simulation (hypothetical) returns and ratios.
Historic Profits
This is simulated compounded returns expressed in percentage Compounded means, in the simulation, the assumption is, the user gained or lost x% returns on its initial principal invested, that entire principal plus (or minus) the returns was reinvested in the next set of recommendations. Returns can be negative or positive. Historic Profits also include Unrealized profits which is described below.
Unrealized gains or profits, also known as "paper profits," represent the increase in value of assets that have not yet been sold. In the context of Upturn.io, these gains occur when a "BUY" recommendation has been issued for a stock or ETF, but no corresponding "SELL" recommendation has been made. Consequently, the asset remains in a "BUY" status, and any potential profits or losses are considered unrealized until a "SELL" recommendation is executed. In simulation scenarios, this means the asset is held without being sold, so the returns are not yet realized.
The compounded profits takes into consideration the simulation of having reinvested the principal and returns for all the recommendations of the Company for the stock since the simulation start date, which is over 2.5 years. The date was chosen to ensure that the simulation data spans more than 2 years and is measured as a percentage. The profits can be positive in case of a profit or could be negative in case of a loss. (The disclosures below provides details about the assumptions while calculating returns in a simulated transaction) [1]
Upturn Advisory Performance
This is a measure of how well Upturn advisory performed for this stock based on simulation. That is, what percentage of times when Upturn Advisory recommended a “BUY” and a corresponding “SELL” did the simulation show a profit.
Stock Returns Performance
This is a measure of how well the stock returns performed with respect to Upturn advisory for the stock based on simulation. That is, what is the cumulative returns for the stock in terms of percentage when Upturn Advisory recommended a “BUY” and a corresponding “SELL”.
SELL Advisory (Profit)
This is for a “SELL” recommendation in the simulation of Upturn recommendations starting over 2.5 years, for the stock which ended in a profit (i.e., positive return).
Note: Refer to Disclosures for Performance Metrics and Simulations which goes into assumptions made in simulation.
SELL Advisory (Loss)
This is for a “SELL” recommendation in the simulation of the Company’s recommendations starting over 2.5 years, for the stock which ended in a loss or negative returns.
Note: Refer to Disclosures for Performance Metrics and Simulations which goes into assumptions made in simulation
Robo-Portfolio performance simulation charts and ratios
Upturn.io's Robo-Portfolio simulations allocate equal weight to each stock, calculating daily returns over approximately the past 2.5 years. The simulations track performance as if executing "BUY" or "SELL" actions based on the platform's advisories. Please review the disclosures for assumptions and considerations regarding simulated or hypothetical returns and ratios. This section details the various performance metrics and terms utilized.
Note: Please read the Disclosures for Performance Metrics and Simulations
Upturn uses Python Empyrical library (or its close implementation)
https://github.com/quantopian/empyrical for the calculation of key ratios and performance metrics of the Portfolio simulation.
Cumulative Returns
This is simulated compounded returns of the Robo-portfolio expressed in percentage. When this is shown in charts, the Robo-Portfolio starts with a principal value of 1 (normalized value for charts) and simulates how it performed if executed "BUY" and "SELL" based on Upturn Advisory on each of the stocks (with the assumptions as discussed in Disclosures for Performance Metrics and Simulations) over the last 2.5 years. The charts also compare these cumulative returns with SPY (S&P SPDR 500 ETF). You can zoom into the performance starting from 1 year ago or 3 months ago
Annualized Returns
This is the mean annual growth rate of returns of the equally weighted Robo Portfolio as per simulation
Sharpe Ratio
This is the risk adjusted return of the equally weighted Robo Portfolio as per simulation
Sortino Ratio
This is the risk adjusted return of the equally weighted Robo Portfolio as per simulation, but it only considers the downside volatility (negative returns) as risk
Annual Volatility
This is a measure of risk in annualized term. It indicates how far the prices could swing in either direction from the average value
Alpha
This is the measure of the equally weighted simulated Robo Portfolio’s ability to beat the market or how does it compares to the market (here SPY is used to indicate market)
Beta
Alpha is typically measured along with beta which measures the overall market risk of the simulated Robo Portfolio (here SPY is used to indicate market)
Max Drawdown
This is the maximum observed loss from a peak to a trough of the equally weighted Robo Portfolio, before a new peak is attained.
Learn more about
- Upturn Insights: Decoding Market Moves
- Understanding Upturn's Stock/ETF Advisory Chart
- Upturn Star Rating for Stocks and ETFs
- Analyzing Revenue: Products, Geography and Growth
- Watchlist, Robo-Portfolios and ETF Zone
- Instant and Custom Robo Portfolios
- Robo Portfolio Performance Metrics
- Upturn Star Rating for Robo-Portfolios
- Upturn’s Analyst Coverage Star Rating
- From Search to Success: Search powered by AI
- Smarter Investment Discovery with Upturn Filters
- Upturn Market Overview
- Descriptions of terms and metrics


Note: This website is maintained by Upturn Corporation, which is an investment adviser registered with the U.S. Securities and Exchange Commission. Such registration does not imply a certain level of skill or training. Investing in securities has risks. Past performance is no guarantee of future returns. No assurance is provided as to any particular investment return, and you may lose money using our services. You are strongly advised to consult appropriate counsel before making any investments in companies you learn about through our services. You should obtain appropriate legal, tax, investment, accounting, and other advice that takes into account your investment portfolio and overall financial situation. You are solely responsible for conducting due diligence on a potential investment. We do not affect trades for you. You will select your own broker through which to transact. Investments are not FDIC insured, they are not guaranteed, and they may lose value. Please see the Privacy Policy, Terms of Use, and Disclosure for more information.
All company names, trademarks, logos, and brands are the property of their respective owners and are used for identification and informational purposes only. Use of these names, trademarks, and logos does not imply endorsement by their respective owners.